By Nick Obergan
The first month of the 2011-12 NHL season is in the books, and the standings arent nearly as clear as they will be in March and April. Some teams dubbed as contenders have started real slow, particularly the defending champion Bruins. On the other end of the spectrum are the teams who had the top two picks in the draft last year, Edmonton and Colorado.
Some stats that jumped out over the first month:
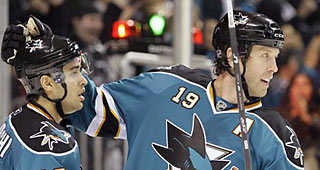
- San Jose is out-shooting their opponents by 10 per game, while the Rangers are being out-shot by 10 per game.
- Edmonton, behind Nikolai Khabibulin, is allowing merely 1.46 GAA per game; Philadelphia, behind Ilya Bryzgalov, is allowing 3.27 GAA per game.
- Two teams are averaging fewer than two goals per game (Anaheim, Minnesota), and Washington is almost doubling them (3.78 goals per game).
- Ottawa has the best power play in the league (31%), while St. Louis has the worst (8.3%).
- Pittsburgh, Chicago and Buffalo are killing off more than 90% of their penalties; Ottawa and Columbus are killing off less than 72% of theirs.
- Colorado is 6-0 in one-goal games (including 4-0 in overtime/shootouts); Columbus is 0-4 in one-goal games.
Many of these numbers are unsustainable, so you will no doubt see a lot of movement after next months power rankings.
As always, the rankings are derived from the
OCTR (click
here for more details).
All stats and information include all games played through October 30, 2011.
| Rank | Team Name | OCTR Total | 10-11 Final Rank | Change |
|---|
| 1 | San Jose Sharks | 70.748 | 3 | +2 |
| 2 | Washington Capitals | 70.636 | 6 | +4 |
| 3 | Pittsburgh Penguins | 63.414 | 5 | +2 |
| 4 | Chicago Blackhawks | 61.760 | 7 | +3 |
| 5 | Philadelphia Flyers | 60.503 | 4 | -1 |
| 6 | Colorado Avalanche | 59.776 | 27 | +21 |
| 7 | Detroit Red Wings | 58.280 | 8 | +1 |
| 8 | Los Angeles Kings | 58.173 | 14 | +6 |
| 9 | Edmonton Oilers | 56.238 | 30 | +21 |
| 10 | Dallas Stars | 55.874 | 18 | +8 |
| 11 | Buffalo Sabres | 55.413 | 10 | -1 |
| 12 | Vancouver Canucks | 55.185 | 1 | -11 |
| 13 | Toronto Maple Leafs | 53.219 | 21 | +8 |
| 14 | Phoenix Coyotes | 52.632 | 12 | -2 |
| 15 | Ottawa Senators | 52.156 | 29 | +14 |
| 16 | Florida Panthers | 51.118 | 26 | +10 |
| 17 | Montreal Canadiens | 49.947 | 16 | -1 |
| 18 | St. Louis Blues | 49.830 | 17 | -1 |
| 19 | Tampa Bay Lightning | 43.590 | 11 | -8 |
| 20 | Boston Bruins | 42.404 | 2 | -18 |
| 21 | Anaheim Ducks | 40.825 | 19 | -2 |
| 22 | New Jersey Devils | 40.185 | 22 | -- |
| 23 | Minnesota Wild | 39.767 | 23 | -- |
| 24 | Calgary Flames | 39.097 | 15 | -9 |
| 25 | Nashville Predators | 36.615 | 9 | -14 |
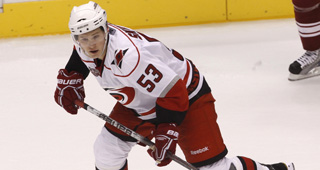
| 26 | Carolina Hurricanes | 36.212 | 20 | -6 |
| 27 | New York Islanders | 35.549 | 28 | +1 |
| 28 | New York Rangers | 32.879 | 13 | -15 |
| 29 | Winnipeg Jets | 32.239 | 25 | -4 |
| 30 | Columbus Blue Jackets | 28.151 | 24 | -6 |
Nick is RealGMs NHL Feature Writer. You can reach him by email [email protected] or on twitter @NickObergan