By Nick Obergan
The 2010-11 season has completed its first calendar month of games, and new and exciting storylines are already developing. Tampa Bay, Montreal, Philadelphia, Los Angeles, Chicago and Colorado are leading their respective divisions, but it is far too early to jump to conclusions.
There has yet to be enough games played to accurately define any team, especially with the number of games played ranging from eight (Boston) to thirteen (Chicago). That said, you can see which playoff hopefuls have dug themselves an early hole (New Jersey, Buffalo, Anaheim, Phoenix), and which teams have started off on fire (St. Louis, Tampa Bay, Montreal).
Last season, RealGM introduced the OCTR, and Washington and Chicago topped the year-end rankings. Using the same formula, this season we will use a Power Rankings format ordered by their OCTR value, with a write-up for every team; this will be done at the end of every month during the season.
All stats and information as of October 31, 2010
1. St. Louis Blues ? 55.708
The Blues have only lost one game in regulation in nine games; Jaroslav Halak is making an early case for the Vezina, as the team is only giving up 1.78 goals against. They also have a +8.8 shot differential per game.
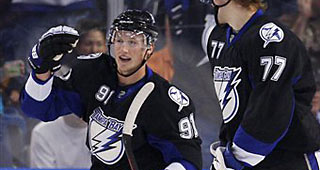
2. Tampa Bay Lightning ? 55.196
Off to a quick start with seven wins in their first ten, and Tampa has 6.8 more shots for than allowed per game. Scoring a league-high 3.5 times per game, but allowing 3 goals against per game is a concern. Third in penalty killing, fourth in power play percentage.
3. Detroit Red Wings ? 53.213
The Wings have six wins in nine games, and are second in the league with a 91.2% penalty kill rate. Also fourth in shots per game, third in faceoff percentage, seventh in shots against per game, but they are only connecting on 18.6% of their power plays.
4. Washington Capitals ? 52.486
Uncharacteristic of their high octane offensive strategy, Washington is tied for third in goals allowed per game on the back of rookie Neuvirth. Despite all of their offensive stars, their power play has been below par (16.7%). They are a perfect 3-0 in Overtime/Shootouts.
5. Los Angeles Kings ? 50.484
The Kings are rolling despite star defenseman Drew Doughty out with an injury. Tied for third in goals against per game, with a high penalty kill rate and low power play conversion rate. They are allowing more shots than they have taken, but Doughty being out is a likely cause.
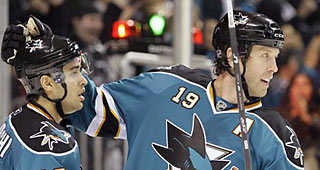
6. San Jose Sharks ? 49.660
After a bit of a slow start, the Sharks are improving behind the Thornton-Heatley-Marleau line. Niemi has struggled mightily out of the gate, but their power play hasn?t ? first in the league at 31.8%. Their +7.6 shot differential per game is a good measure of their success.
7. Boston Bruins ? 49.628
Only 11 goals allowed in eight games (1.38 ? first), one being an empty netter, and only eight while playing 5-on-5. Tim Thomas has found the fountain of youth to get back to his Vezina-winning ways, and the offense is much better than last year, averaging three goals per game so far.
8. Pittsburgh Penguins ? 46.131
It?s been an up and down start to the season, thanks in large part to their ineffective power play (12.9%). Marc-Andre Fleury has been largely atrocious, but backup Brent Johnson has kept the Pens above water despite injuries on defense.
9. Philadelphia Flyers ? 44.638
Numbers across the board are similar to their state and division rivals in Pittsburgh. With starting goalie Leighton hurt, they have gotten a big lift from unheralded rookie Sergei Bobrovsky. Their power play (17%) and faceoffs (48.2%) need to improve.
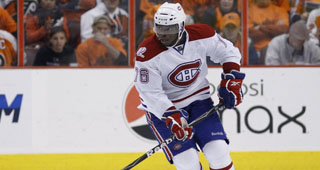
10. Montreal Canadiens ? 44.341
Carey Price has been very good in the wake up of preseason criticism. Their power play is the worst in the league right now (7.7% conversion rate). Team?s 2.27 goals against per game is third, but they are only scoring 2.64 per game.
11. Calgary Flames ? 43.793
They sit at 6-5-0, with their head coach calling out star captain Iginla (albeit without naming him specifically). They are finally scoring goals (2.91) but are uncharacteristically allowing more (3.09). Like many teams, their power play (11.8%) needs to be better.
12. Chicago Blackhawks ? 43.394
Only seven wins in a league-high 13 games, with Kane (-7) and Toews (3G, 13GP) starting slow, while Hossa (7G, 11GP) and Sharp (10G, 12GP) have not. Marty Turco looks to be finding his form, but they are allowing an unhealthy 32.5 shots per game.
13. Colorado Avalanche ? 42.041
Scoring a tonne (3.46 per game), but giving up more (3.54), and that may not change with the stellar Craig Anderson injuring his knee. Chris Stewart is on fire early (9G, 11GP), but can they improve their penalty killing (73.9%) with their starting goalie injured?
14. Vancouver Canucks ? 39.689
It?s hard to get a gauge on their new defensive unit, when they have yet to be at full strength, but the goaltending has been good (2.44 goals allowed, despite 30.8 shots against). Daniel (7G, 9GP) and Henrik (11A, 9GP) have carried a mediocre offense.
15. Columbus Blue Jackets ? 39.493
The Jackets have six wins in ten games, despite only scoring 2.3 goals per game. Captain Rick Nash (3G, 2A) needs to be much, much better if they are to succeed in the highly competitive Central. Steve Mason (3.30GAA, .894 SV%) needs to be better as well.
16. Toronto Maple Leafs ? 37.710
After a 4-0-0 start, Toronto can?t buy a goal ? shutout twice in a row, and only four goals in the last five games. Both goalies have been good, and the team is only allowing 2.3 goals against and 26.5 shots against. Kessel (7G) is on pace for over 55 goals.
17. Dallas Stars ? 36.913
After a 5-1 start, Dallas has come back down to earth. Their team defense has been terrible, allowing almost five more shots per game than they have taken. Their special teams is also at the bottom of the league (68.4% penalty kill rate, 14% on power plays).
18. Florida Panthers ? 35.212
Their team defense and goaltending have been terrific, allowing just 2.33 goals against. Unlike previous seasons, they have more shots on net than they have allowed. Their struggling power play (9.4%) is a result of having no star offensive players.
19. New York Islanders ? 34.902
Defenseman Wisniewski (11P, 9GP) has been a revelation, despite his career high in points being 30. Sophomore Tavares is sniping (6G, 8GP) early and often, but 3.27 goals against won?t help you win many games.
20. New York Rangers ? 32.355
Lundqvist struggled early, but has won three of four with a shutout on Saturday. With Gaborik out, they need to bring down their 3.00 goals allowed per game, as well as penalty killing (77.3%), and defense (33 shots per game allowed).
21. Carolina Hurricanes ? 32.210
Ugly numbers across the board: 2.4 goals for vs. 3 against; 12.8% power play, 77.5% penalty kill; 35.4 shots against per game; woeful 37.2% on faceoffs. Cam Ward?s been good; so has rookie Jeff Skinner (3-4-7, +1 in 10G). Could improve after a tough road trip to start the year.
22. Minnesota Wild ? 31.932
Only 12 even strength goals in 10 games isn?t going to win you many games. Mikko Koivu (11P, +5, 10G) and Matt Cullen (10P, -4, 10G) have carried things up front. Goaltender Backstrom has done his job (2.08 GAA). They only have 25.6 shots on net per game.
23. Nashville Predators ? 31.380
Even though they have a 5-2-3 record, they have allowed more goals (2.5) than they have scored (2.3). The offense is struggling while missing Matthew Lombardi, out with a concussion. Team defense has been subpar as well, allowing 34.1 shots per game, and they are 0-3 in Overtime/Shootouts.
24. Atlanta Thrashers ? 30.300
Up and down start to the year, as they haven?t won more than two in a row. Antropov (4 points) and free agent signee Chris Mason hasn?t lived up to standards (3.50 GAA), but former Hawks Byfuglien (10P, 11G) and Ladd (12P, 11G) have been stellar so far.
25. Buffalo Sabres ? 28.354
A horrible 3-7-2 start for last season?s division winners. Ryan Miller hasn?t been as awesome as last year, but not terrible (2.71 GAA, .903 SV%). The offense hasn?t helped, scoring 2.5 goals a game, despite taking more shots than they have allowed. Tyler Myers (-10) has really struggled.
26. New Jersey Devils ? 25.189
Easily the season?s biggest surprise and disappointment so far at 3-8-1. The team has really missed the injured Anton Volchenkov on defense, but it is their offense that has been the biggest culprit (1.67 goals per game). With Kovalchuk, Parise, Zajac and Elias on the roster, Danius Zubrus shouldn?t be the leading scorer (7P in 12G).
27. Ottawa Senators ? 24.092
The Sens are right below the Devils on the disappointment list. Spezza has been hurt and that has limited the team offense (2.36 goals per game). Gonchar (0G, 6A, -7) and Kovalev (5P, -4) are major culprits, as Alfredsson (12P, 11GP) hasn?t gotten any secondary scoring.
28. Phoenix Coyotes ? 22.519
Phoenix is the West?s biggest disappointment so far at 3-4-3. Ray Whitney (0G, 3A) hasn?t helped the struggling power play (9.1% conversion rate), and they are giving up a tonne of shots (35.1), uncharacteristic of a Dave Tippett squad.
29. Edmonton Oilers ? 19.414
The team has been poor (3-4-2, 3.44 GAA, 70.4% penalty kill rate, 43.4% on faceoffs, 35 shots allowed per game with only 26.8 on net themselves per contest), but the kids ? Eberle (8P, 9G), Hall (2 goals in the last 2 games), Paajarvi (6P, 9G) ? have been fun to watch.
30. Anaheim Ducks ? 18.362
Ducks are off to a terrible start at 4-7-1 and are becoming the victims of their own depleted back-end. Their best defenseman has been rookie Cam Fowler, and they are giving up a league-high 38.8 shots on net.
Stats of the OCTR: Wins-Losses-OT Losses; Point percentage ? which is the percentage of available points the team has secured during their games played; Goals for and against; Shots for and against; Power play and penalty killing %; Percentage of wins in 1 goal games; Percentage of wins in overtime games; Point percentage over the last 10 games; Season point percentage of opponents faced over the last 10 games; Team faceoff percentage (FO%).
Nick is RealGM?s NHL Feature Writer. You can reach him by email [email protected] or on twitter @NickObergan
More stories: